JeanCarl's Adventures

LED Pin: Displaying the stats on a wearable, Part II

April 15, 2016 | Node-RED

Last week I showed how to deploy a Node-RED application that analyzed the tone of tweets using the Watson Tone Analyzer. The results were displayed on a webpage. In this blog post, we’ll connect the Node-RED application to the Watson Internet of Things Platform and control a NeoPixel LED ring powered by an Arduino compatible Particle Photon board.

First we need to register a new device with the IoT Platform. In the application overview in IBM Bluemix, click on the Internet of Things Platform service tile.

Photo

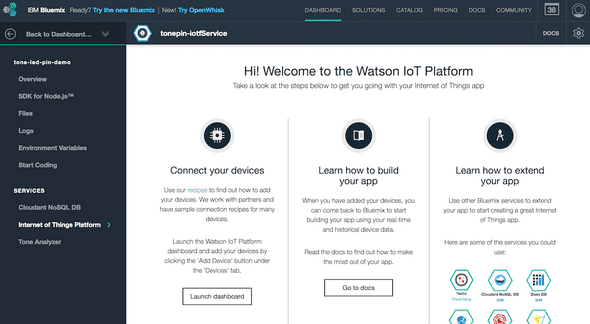
Click on the Launch dashboard button at the bottom of the first column.

Photo

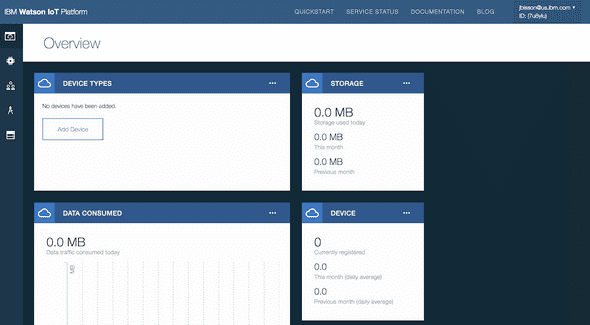
This is the IoT Platform dashboard where you can add and remove device types and devices, get API keys, and view data and events that pass through the service.

Photo

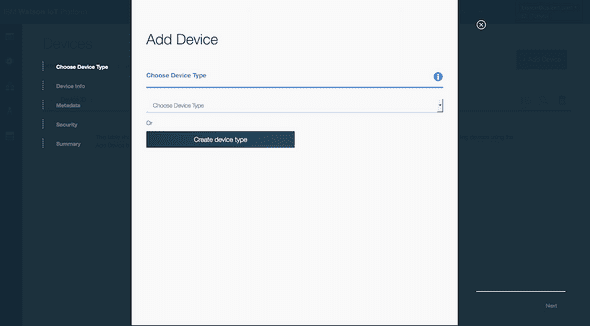
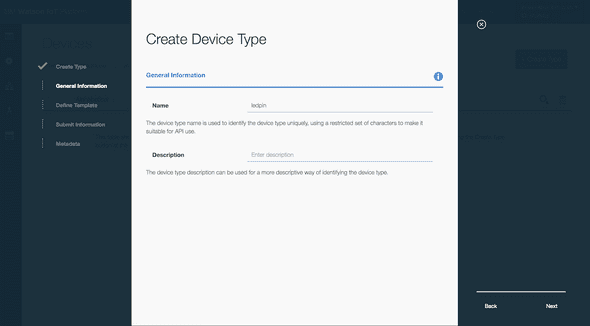
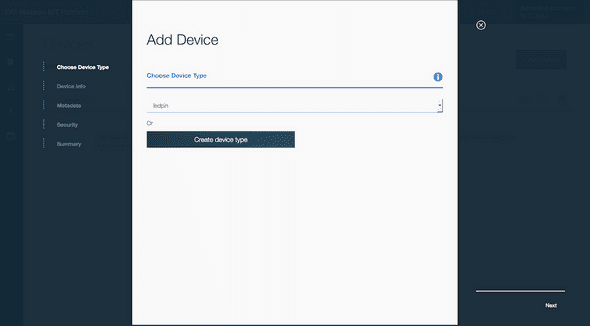
Click on the Add Device button. We first need to create a device type, which is basically a named type for similar devices. I’ve chosen to use ledpin, but you can choose whatever you want. Skip through the rest of the steps until you return back to the Add Device screen with the new device type listed in the drop down menu. Select the device type that was just created and click Next to add a single device.

Photo

Photo

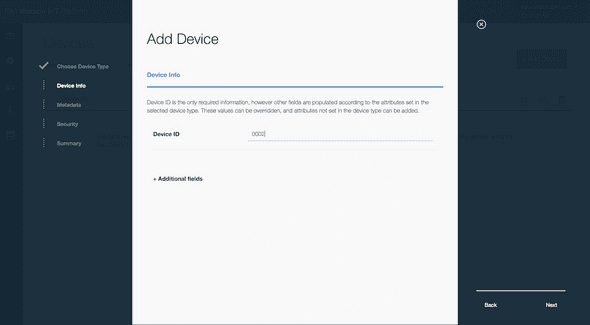
Now we’re going to get specific to a single device, of type ledpin. Enter a unique ID for this device. If you add another pin in the future, it will have the same type ledpin, but with a different Device ID. This way, each device has separate data streams and can be accessed individually.

Photo

Photo

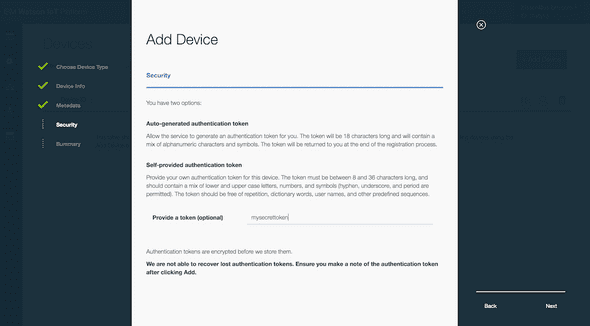
Skip to the screen where you can choose a token. You can choose a specific token that is used when authenticating the device to the IoT Platform service. Or, leaving this blank will generate a randomized token (similar to a password).

Photo

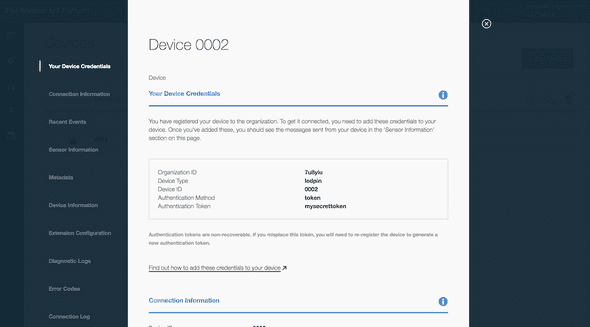
The final screen will show the credentials necessary to connect the device to the IoT Platform service. Keep this info handy as the token is only shown once.

Photo

Configure Node-RED to publish the statistics

The next step is to configure the IoT nodes in Node-RED to send the device the statistics when two events occur:

  • when the pin connects to the IoT Platform service
  • once a minute when the last minute stats are updated

Add an ibmiot in node on the left side, and add an ibmiot out node on the right side of the flow, connecting them together as follows:

Photo

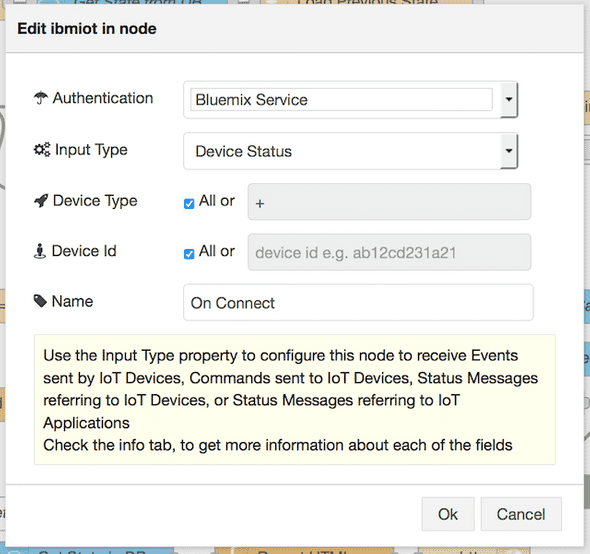
In the ibmiot in node, enter the device type and device ID from the Watson IoT Platform service.

Photo

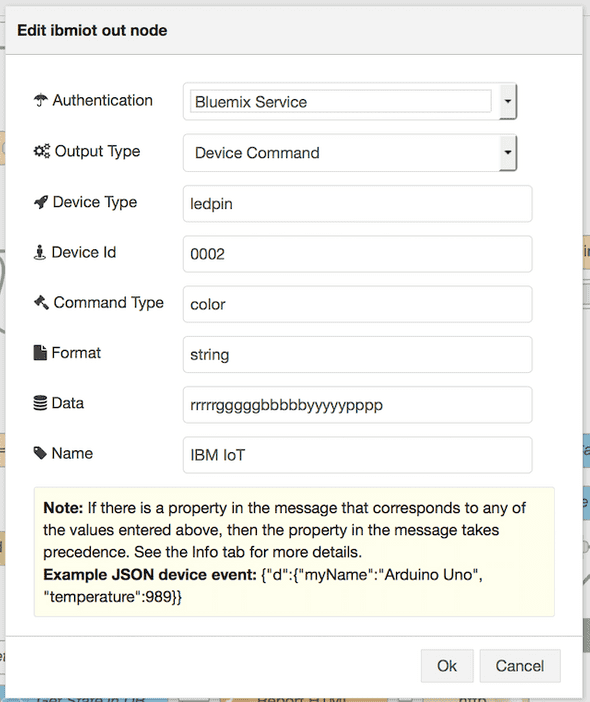
In the ibmiot out node, enter the Device Type, Device ID values from the Watson IoT Platform and the remaining values as shown below:

Photo

Click on the Deploy button in the top right corner of the page to save and deploy the changes.

The LED Pin hardware

For the hardware, I used a Particle Photon and a NeoPixel Ring with 24 LED lights.

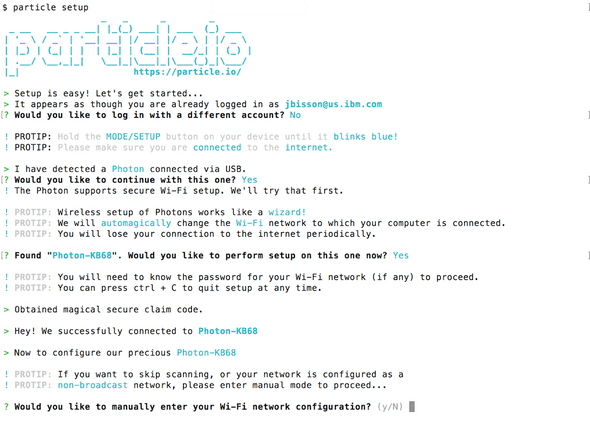
Sign up for an account on the Particle.io website, sync the device via USB and the command-line interface.

Photo

This process makes it quick and easy to write Arduino code in the web browser IDE and deploy it to the device (called flashing the device).

Photo

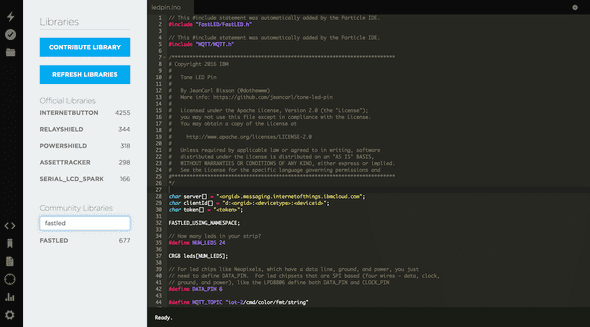
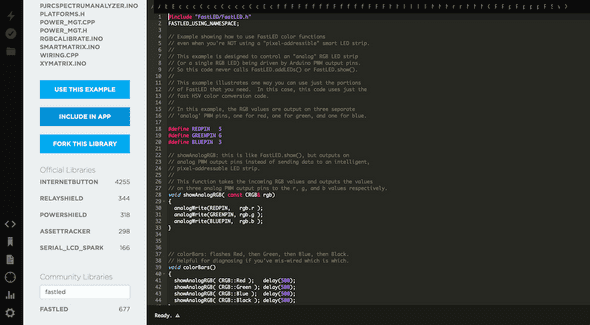
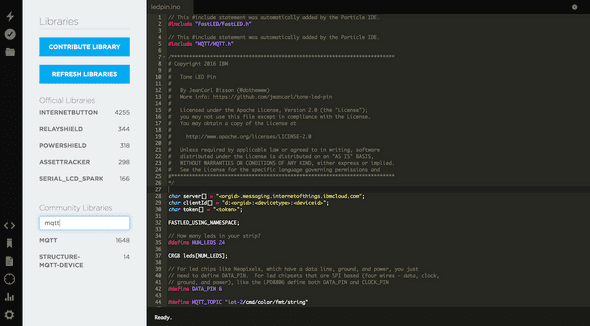
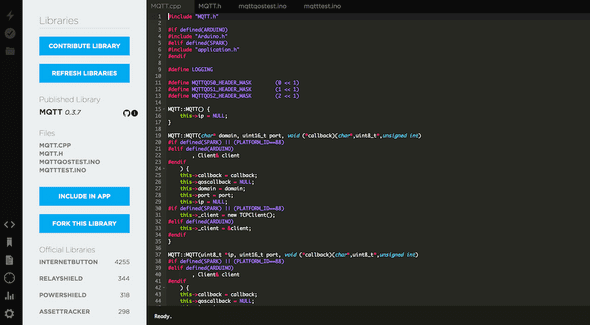
You can find the Arduino code in my GitHub repo. Copy the contents of the main.ino file into the web IDE. There are two libaries that need to be included in the application. Click on the Libraries icon in the left sidebar. Search for the FASTLED library. Click on the search result. Scroll down and click on Include in App.

Photo

Photo

Repeat this process for the MQTT library.

Photo

Photo

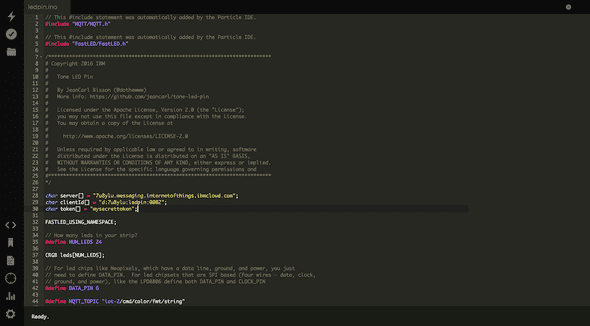
Finally, copy the device credentials created earlier in the Watson IoT Platform service and replace the following:

  • <orgid> with the Organization ID
  • <deviceid> with the Device ID
  • <token> with the authenication token

Photo

Click on the Verify button in the left sidebar to confirm the code compiles. Then click on the Flash button in the left sidebar. The code will be pushed to the LED pin.

The pin should change colors when it restarts and connects to the Watson IoT Platform service successfully. After a minute, the LEDs may change colors, dependent on the activity of the Twitter search.

How does pin change color?

When the pin connects to the Watson IoT Platform, or when the Node-RED application updates the last minute stats, the pin receives a message in a format like:

rrrrrgggggbbbbbyyyyypppp

This message instructs the pin to color each LED light a specific color. In the above example, the first five LED lights are colored red, the next five colored green, the next five colored blue, the next five colored yellow, and the last four colored purple.

Here are a couple of modifications that you can tinker with:

  • change the pattern of the LEDs displayed on startup: change the Data textbox in the ibmiot out node
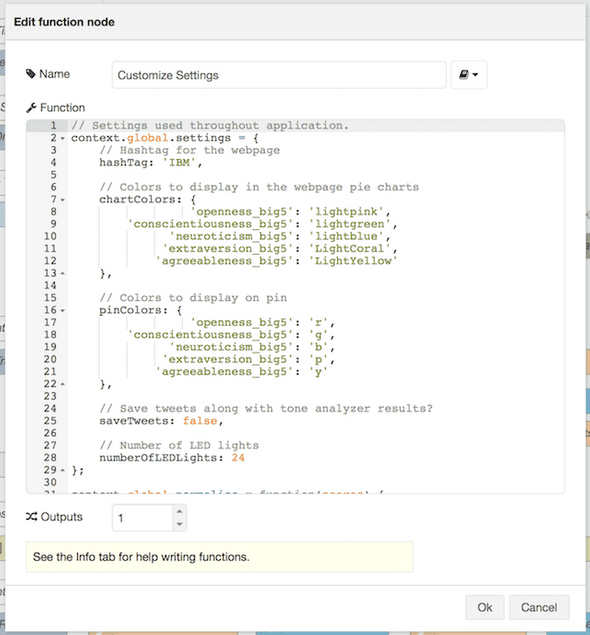
  • change the colors of each tone category: double click on the Customize Settings node and change the colors in the pinColors property
  • add new colors on the LED pin: add new case statements in the switch statement located in the callback function

What else can you represent using 24 LED pins? You can expand this application to toggle between different modes, just by pushing new messages via the Watson IoT platform to the pin. The possibilities are practically endless.

Congratulations! You made it through a gauntlet of social media, Cloud services, and hardware to create your very own LED pin and website showing the tone from tweets on Twitter.
Harker School Research Symposium

April 12, 2016 | Conferences

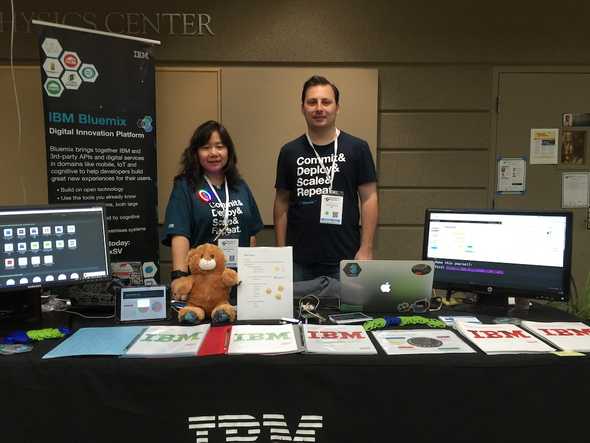
On Saturday, I had the opportunity to attend the Harker Research Symposium in San Jose. Angie Krackeler, also with IBM, and I inspired students and their parents on how they could use Node-RED and other services available in IBM Bluemix to make a variety of applications in just a few hours. Several of the demos used Node-RED, a graphical interface of drag and drop blocks built on top of the Node.js runtime.

Photo

Photo

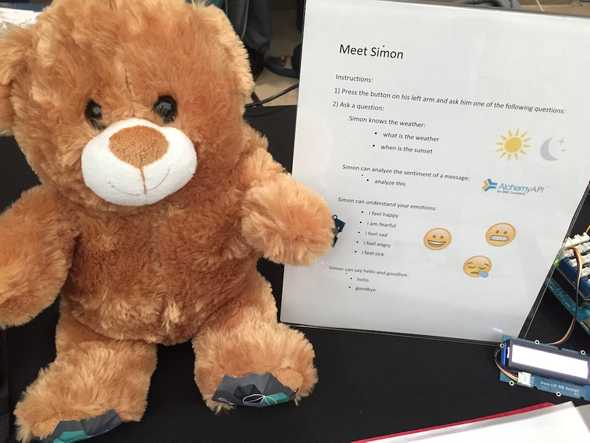
Simon, the talking teddy bear, made his debut. Simon listens to your voice through a small microphone. The speech is converted to text via the Watson Speech to Text API server available in IBM Bluemix. A Node-RED application running on Bluemix matches the command to one of a handful of skills I’ve trained Simon to handle. The skill handler returns text back to Simon, where he uses the Watson Text to Speech API service to get the audio to play via a Bluetooth speaker. Simon is powered by an Intel Edison board using sensors from the Grove kit. Some of the skills Simon has learned include the current weather, what time the sun will set, how to analyze the sentiment of free-form phrases, and how to respond to a set of emotions (for example, I feel happy). Simon uses lessons learned from his older brother Alex the IoT Bear.

Photo

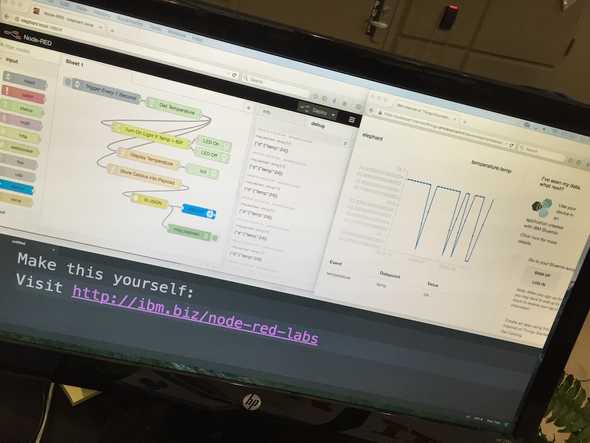
Other demos we showed included the Tone LED pin that analyzes the tone of tweets around a search term, for example IBM, and using 24 LED lights, the ratio of the Big 5 personality traits most prevalent in tweets per minute is displayed. An Intel Edison board using a Grove temperature sensor showed how you can quickly build an alert system when temperatures rise above a specified threshold.

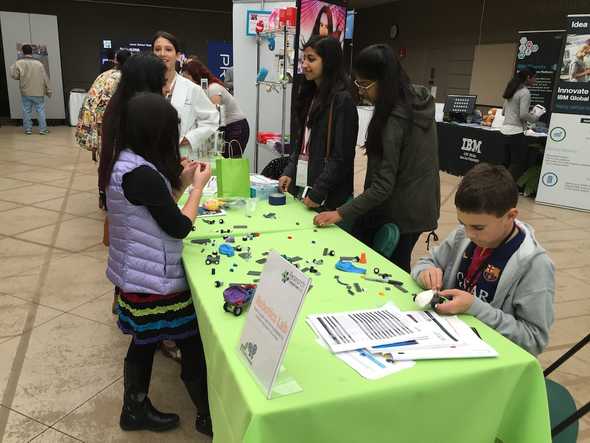
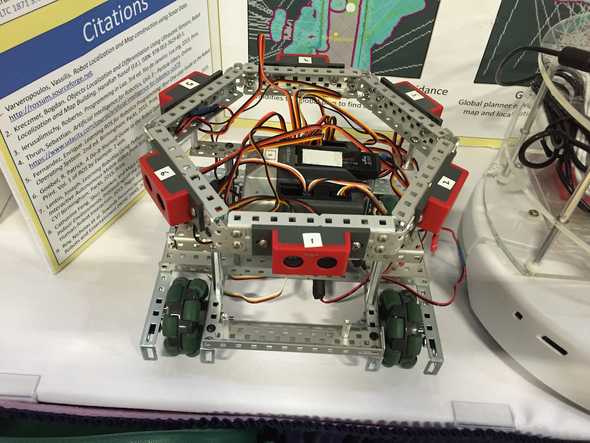
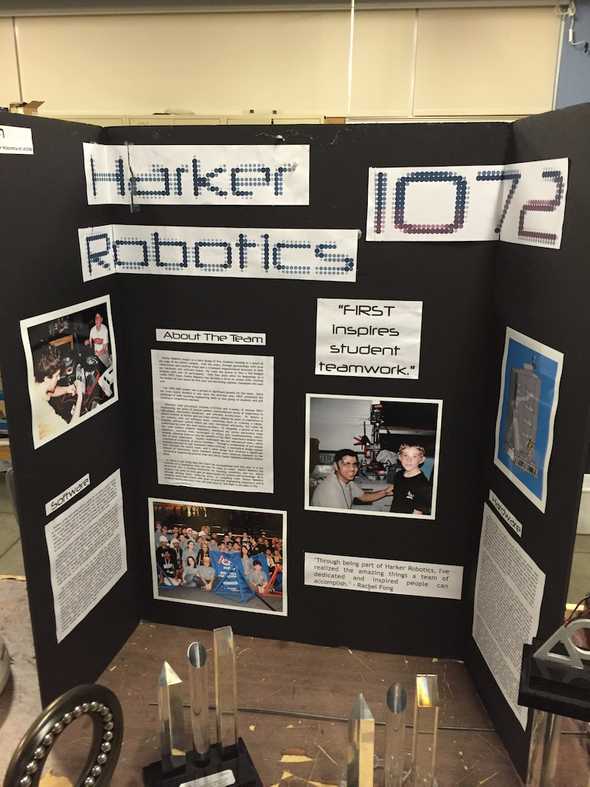
I had the chance to see what the students have been working on. There was a Robotic Lab where students could build a LEGO robot powered by a balloon.

Photo

A demonstration of controlling robots from the Programming Skills Challenge Champion at the 2016 California State Championship.

Photo

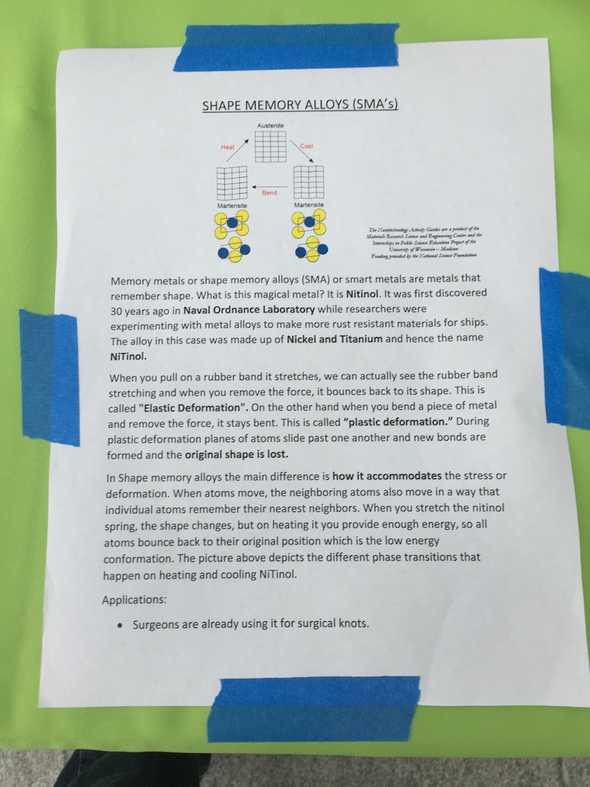
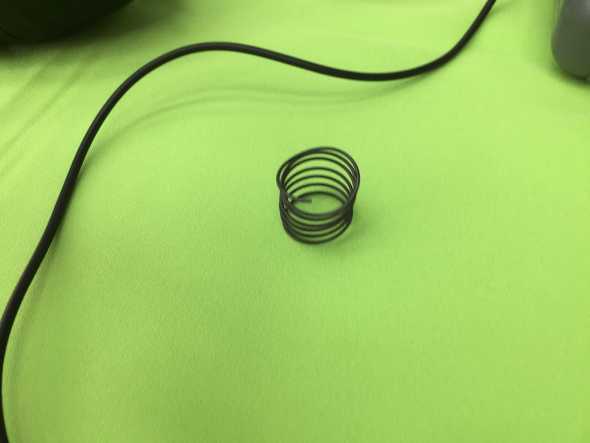
Students showed off a fun experiment where a piece of wire made of Nitinol reformed into a coil under heat from a hair-dryer. The wire is composed of memory metals that remember their shape.

Photo

Photo

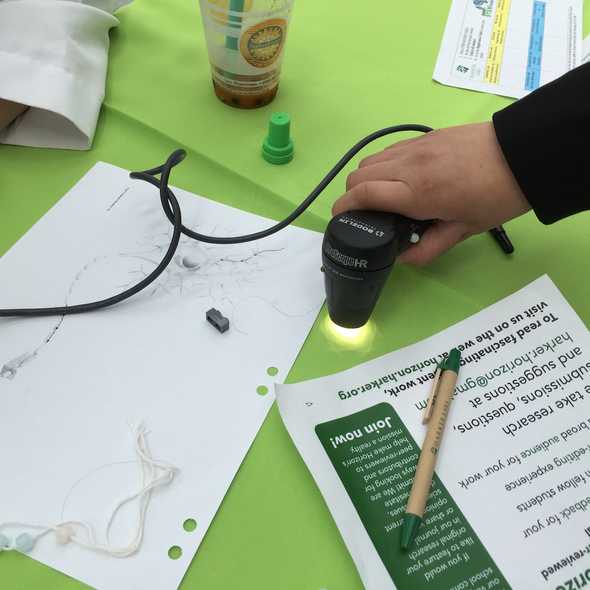
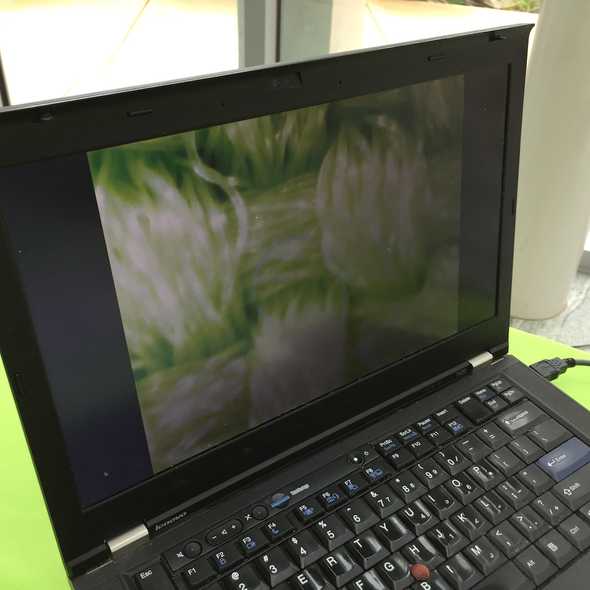
Have you ever wanted to see things up close? Students at another table showed how a Proscope magnified little details, such as the threads of a tablecloth.

Photo

Photo

In the Gym, students shared their research in a number of different topics. These students have shown some impressive skills in research that can inspire us all.

Photo

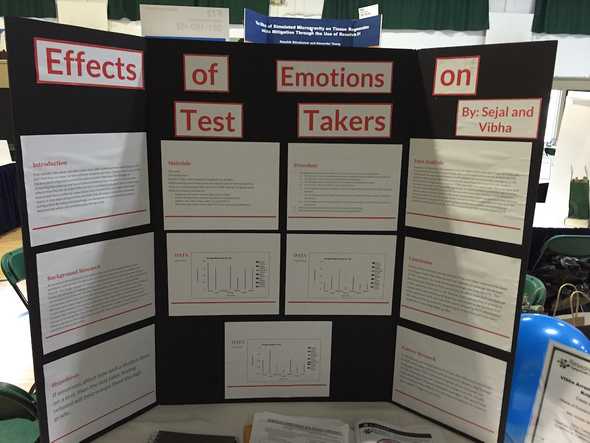
For each project, the students had to state an Introduction, Objectives, Background Research, a Hypothesis, Materials needed, the Procedure, Data Analysis, a Conclusion, and Further Research. Some topics included:

  • Effects of Emotions on Test Takers

    Photo

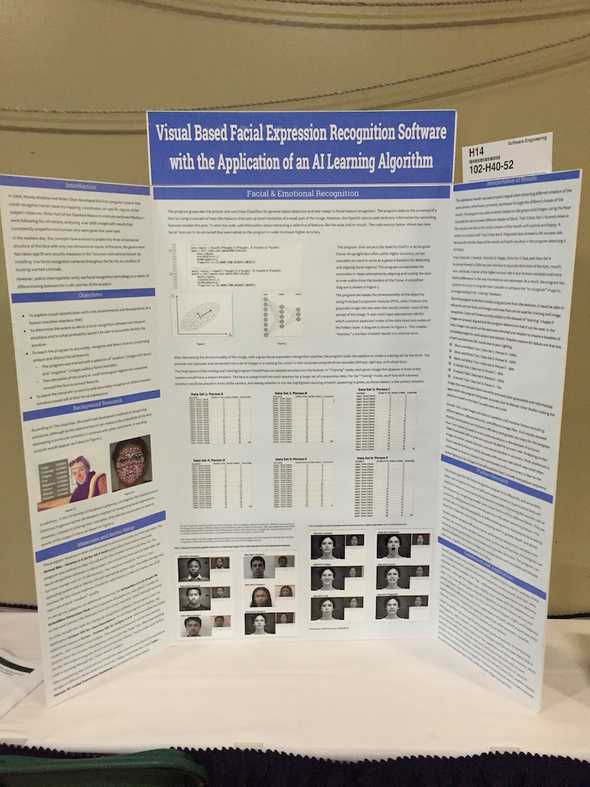
  • Visual Based Facial Expression Recognition Software with the Application of an AI Learning Algorithm

    Photo

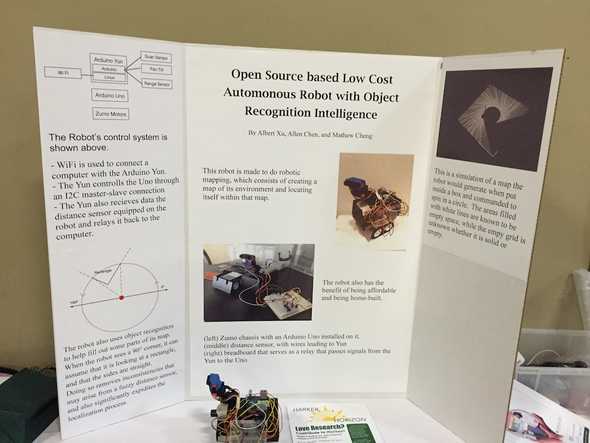
  • Open Source based Low Cost Automonous Robot with Object Recognition Intelligence

    Photo

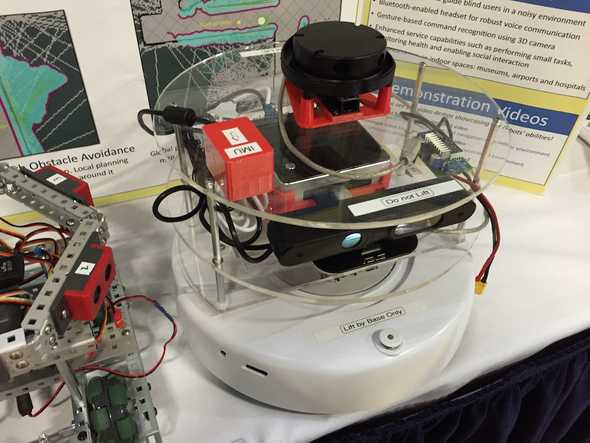
  • A Location-Aware Service Robot For the Blind!

    Photo

    Photo

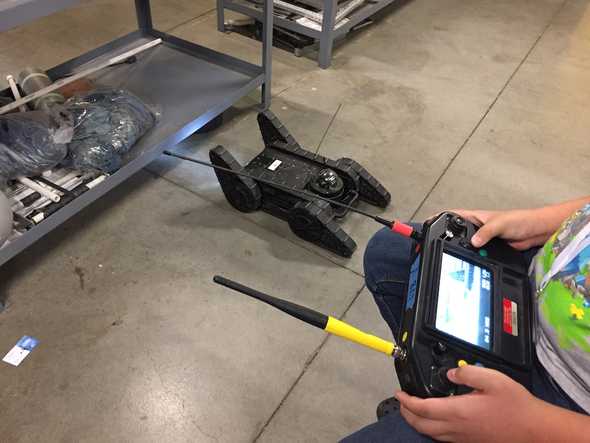
In the woodshop, ehmm, nowadays referred to as the Robotics shop, a student was controlling a military-grade rover with some heavy-duty tracks and maneuverability, and a camera that streamed to the controller.

Photo

Photo

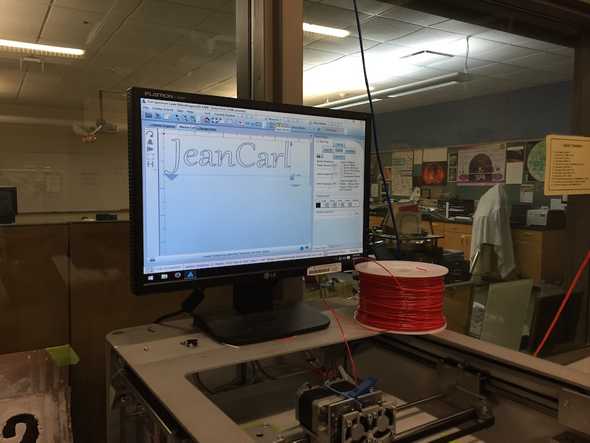
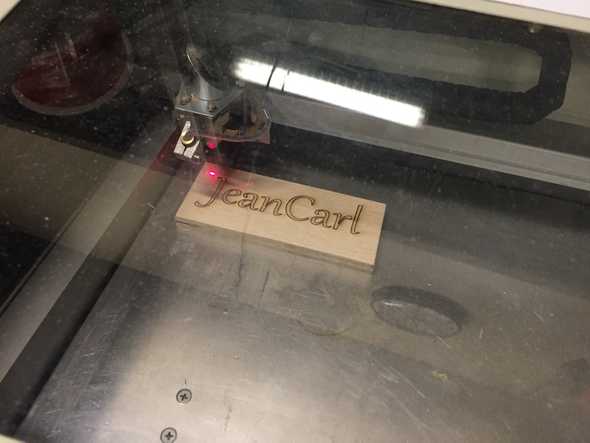
Another group of students demonstrated using a Laser machine to scribe your name on a block of wood to take home as a souvenir.

Photo

Photo

It was truly inspiring to see the next generation showing such amazing intelligence and dedication to learning some really powerful things and discovering new research in the process. They are truly on the path to changing the world and the way we live and interact everyday.

LED Pin: Analyzing the tone of tweets, part I

April 08, 2016 | Node-RED

In this two-part tutorial, I’m going to show how you can analyze the tone of tweets from Twitter and display the percentages on a webpage and on a wearable LED ring. There are two components to this project. The first part will show how to deploy a Node-RED application hosted on IBM Bluemix and analyze the tweets using the Watson Tone Analyzer service, displaying the results in a webpage.

The second part will show how to build a wearable LED pin, connect it to the Watson IoT Platform, and display the percentages. The second part is optional, but if you’re adventurous, you can get down to the hardware (literally), and display the results using LED lights. Trust me, everyone notices your wearable and asks what it does.

Deploy Node-RED application

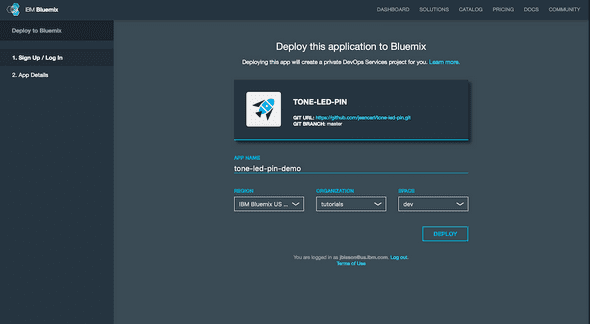
I’ve created a GitHub repo that contains the Node-RED application. To make this really simple (thank me later), you can just click this button to deploy the application to IBM Bluemix.

Photo

If you’re not logged in, you’ll be prompted to either login or signup for a new account. After that, choose an application name, the region, organization, and space you want to deploy the application to. Note that the application name will be used as the host name of your application, for example http://myapp.mybluemix.net.

Photo

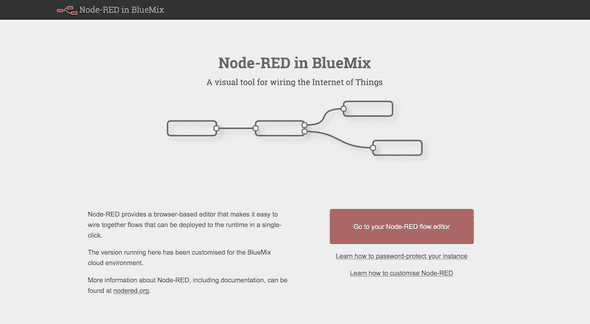
Creating and deploying the application will take a few minutes. When complete, click on the View Your App button at the bottom of the page. Copy this URL for later. Click on the red Go to your Node-RED flow button.

Photo

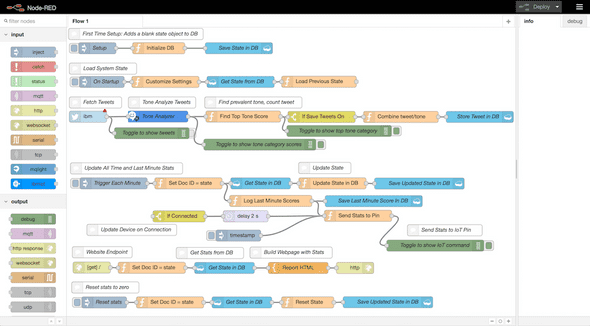
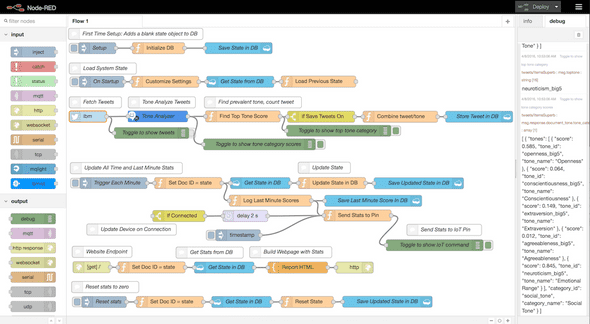
Welcome to Node-RED! This graphical interface makes it quick and easy to prototype a new application on top of the Node.js runtime environment. Nodes in the left sidebar can be dragged into the middle canvas and connected together to construct flows, or programs of functionality. You can access third-party nodes and IBM Watson nodes, just to name a few of the options.

Photo

Most of the project’s functionality is already added to the canvas. However, there are a few things left to do.

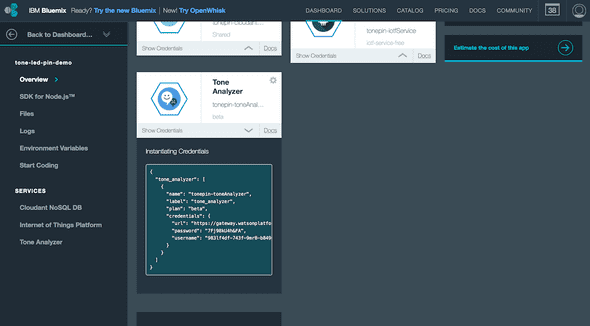
First, we need to configure the Tone Analyzer node with the service credentials from the Watson Tone Analyzer service in IBM Bluemix. Open a new tab and visit your IBM Bluemix dashboard at bluemix.net. Locate the application. In the Overview tab of your application, click on the Show Credentials link under the Tone Analyzer service tile. Inside the JSON, copy the username and password values.

Photo

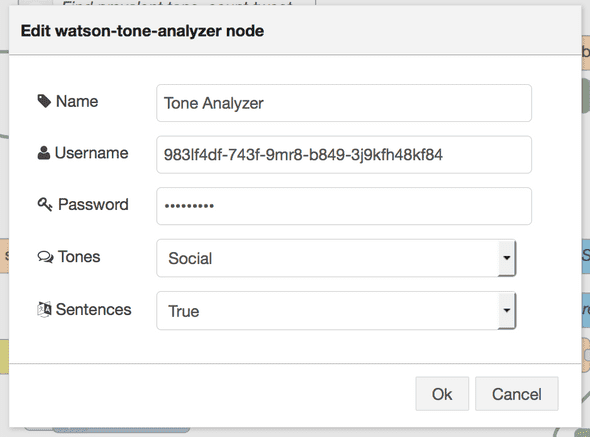
Back in Node-RED, double click on the Tone Analyzer node and enter those username and password values. Click OK.

Photo

Next, double click on the Customize Settings node. Here you can customize the title and change colors. Click OK.

Photo

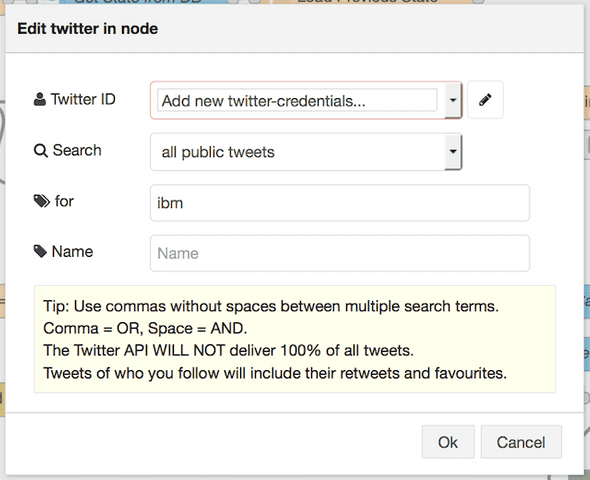
Next, double click on the Twitter node. Enter a search term in the text field titled for.

Photo

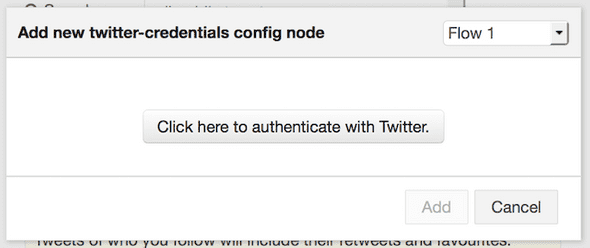
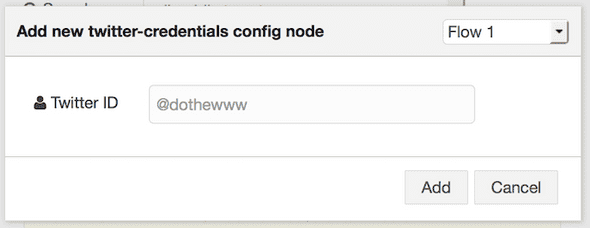
Click on the pencil icon. Click on the button labeled Click here to authenticate with Twitter. Login with a Twitter account. Don’t worry, this application won’t tweet anything. It is only required to access the Twitter API where the tweets are pulled from.
Photo

Photo

Click on the red Deploy button in the top right corner. This will save and deploy the application.
The first time you deploy this application, click on the tab of the Setup node. This will create the necessary document in the Cloudant NoSQL database where the statistics are stored. This step only needs to be done once.

Depending on how popular the search term you chose is, you may see the data flowing in the Debug tab on the right. You can toggle the green tabs to display/hide the data passing through the flows. I’ve added a couple of them for convenience to see what the application is doing.

Photo

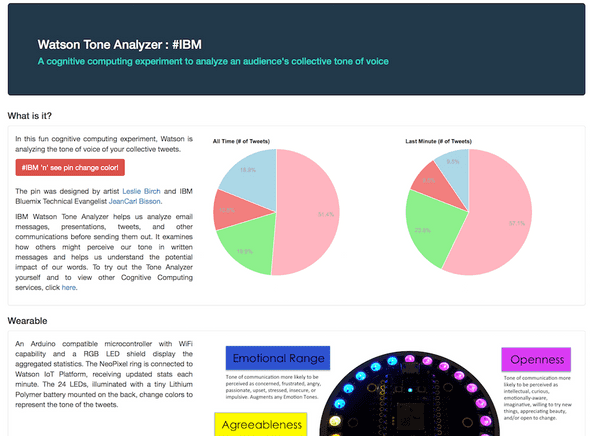
Open a new tab and visit your application’s URL. This webpage is constructed in the Report HTML node, and can be customized if desired. The webpage features two pie charts which update every minute. The one on the left shows the tone distribution of tweets since the start. The pie chart on the right displays the tone distribution of tweets from the last minute. If no tweets have been processed during this period, this pie chart won’t be displayed.

Photo

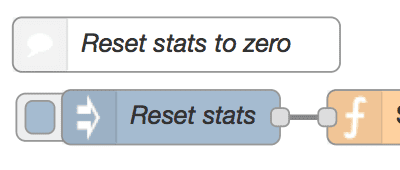
You can reset these statistics by clicking on the tab to the left of the Reset node back in the Node-RED application.

Photo

Come back next week to learn how to connect this application to the Watson Internet of Things platform and to a wearable LED pin.

A working demo that tracks tweets mentioning IBM can be found at http://tone-led-pin-demo.mybluemix.net

New Node-RED nodes!

March 31, 2016 | Node-RED

If you have deployed a Node-RED starter application in IBM Bluemix recently, you might have noticed a couple of new nodes that are now available.

OpenWhisk trigger or action

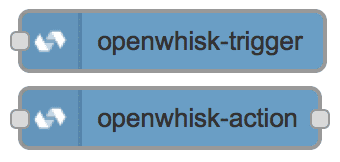
IBM announced OpenWhisk last month an InterConnect. OpenWhisk provides a distributed compute service to execute application logic in response to events. You can run JavaScript, Swift, and more complex solutions via these nodes.

Photo

The Weather Insights

The Insights for Weather service allows you access historical and real-time weather data from The Weather Company. Simply provide a location and get current weather observations and weather forecasts via this node.

Photo

Tone Analyzer

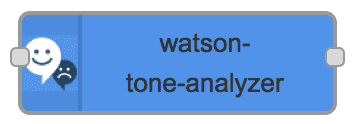
The Tone Analyzer service joined the IBM Watson category in the Bluemix Catalog recently. The Tone Analyzer service uses linguistic analysis to detect emotional tones, social propensities, and writing styles in written communication.

Photo

The npm package that were changed include:

Get started with Node-RED with these new nodes, along with many more, by clicking on the Deploy to IBM Bluemix button below:

Photo

Node-RED on Koding using IBM Bluemix services

February 20, 2016 | Hackathons

Get ready. Get set. Go! The Koding hackathon is underway. You can find more details about the virtual hackathon, but I wanted to share how I got Node-RED running on a Virtual Machine via the Koding service. If you haven’t heard about Node-RED yet, head over to nodered.org.

In short, Node-RED is an awesome graphical interface that lets you connect nodes together to create functionality that runs on top of a Node.js environment. Functions let you extend to your heart’s content by writing JavaScript. I created a connected IoT Teddy Bear with it.

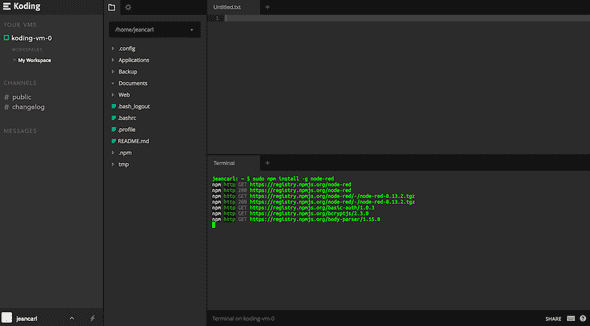
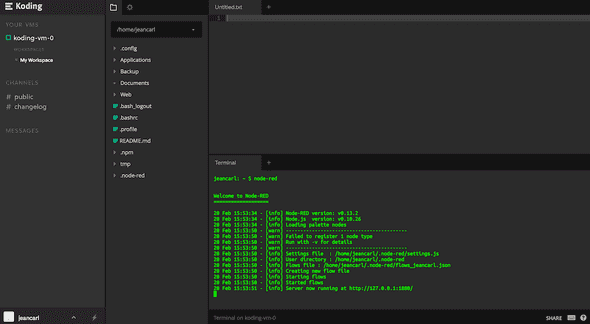
Installing Node-RED on a virtual machine is pretty simple. Open up the terminal on the VM and type the following command:

sudo npm install -g node-red

Photo

To start Node-RED, use the node-red command:

node-red

Photo

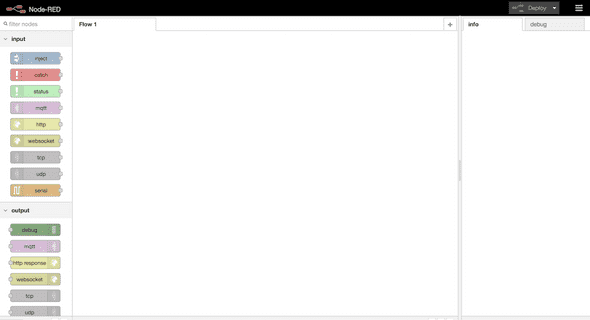
This will start up Node-RED and make it available on port 1880. You can launch a browser to:

http://<your-vm-ip>:1880

Photo

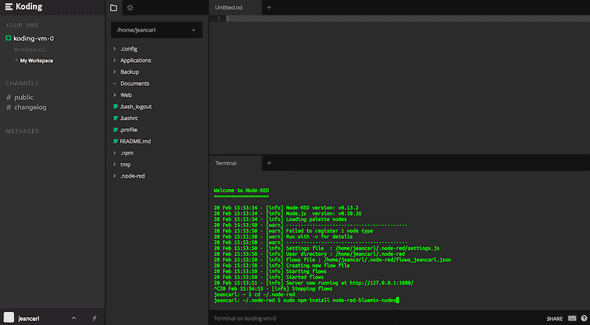
Let’s add some additional nodes that can interact with some of the IBM Bluemix services. Stop Node-RED in the terminal to return to the command line. Change directory to ~/.node-red

cd ~/.node-red

First, we’ll install node-red-bluemix-nodes which contains nodes that can be used with IBM Watson.

sudo npm install node-red-bluemix-nodes

Photo

Let’s also install the node-red-node-cf-cloudant package to add nodes to use with IBM’s Cloudant NoSQL database.

sudo npm install node-red-node-cf-cloudant

And finally, the node-red-contrib-scx-ibmiotapp package adds some Internet of Things nodes that are helpful when connecting devices like the Intel Edison or Raspberry PI.

sudo npm install node-red-contrib-scx-ibmiotapp

To start Node-RED, run the node-red command again:

node-red

And launch a browser to:

http://<your-vm-ip>:1880

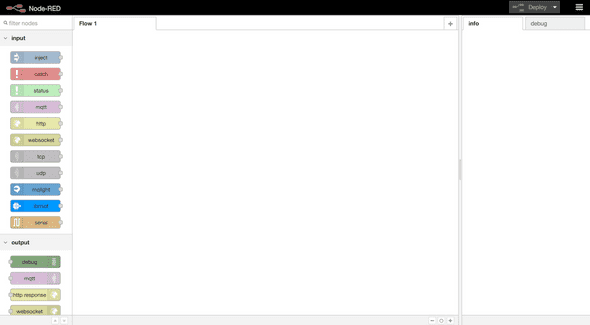
You’ll notice the additional nodes that have been added to the palette in the left sidebar. Check out the IBM_Watson section where you can use Text to Speech, Personality Insights, and Language Translation nodes, just to name a few.
Photo

What’s next? I have several tutorials on my GitHub account showing how to create Node-RED flows using Text to Speech, Language Translation, and Personality Insights.