LED Pin: Analyzing the tone of tweets, part I
April 08, 2016 |
In this two-part tutorial, I’m going to show how you can analyze the tone of tweets from Twitter and display the percentages on a webpage and on a wearable LED ring. There are two components to this project. The first part will show how to deploy a Node-RED application hosted on IBM Bluemix and analyze the tweets using the Watson Tone Analyzer service, displaying the results in a webpage.
The second part will show how to build a wearable LED pin, connect it to the Watson IoT Platform, and display the percentages. The second part is optional, but if you’re adventurous, you can get down to the hardware (literally), and display the results using LED lights. Trust me, everyone notices your wearable and asks what it does.
Deploy Node-RED application
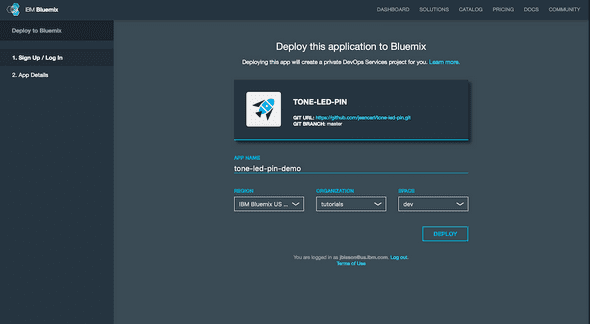
I’ve created a GitHub repo that contains the Node-RED application. To make this really simple (thank me later), you can just click this button to deploy the application to IBM Bluemix.
If you’re not logged in, you’ll be prompted to either login or signup for a new account. After that, choose an application name, the region, organization, and space you want to deploy the application to. Note that the application name will be used as the host name of your application, for example http://myapp.mybluemix.net.
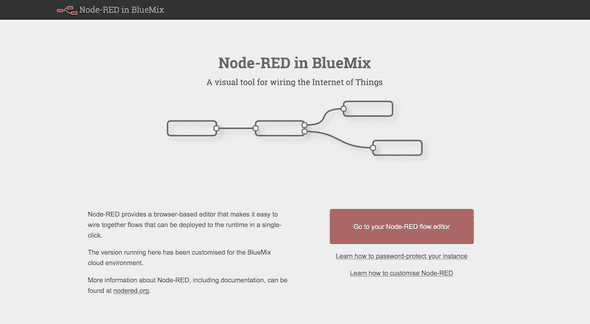
Creating and deploying the application will take a few minutes. When complete, click on the View Your App button at the bottom of the page. Copy this URL for later. Click on the red Go to your Node-RED flow button.
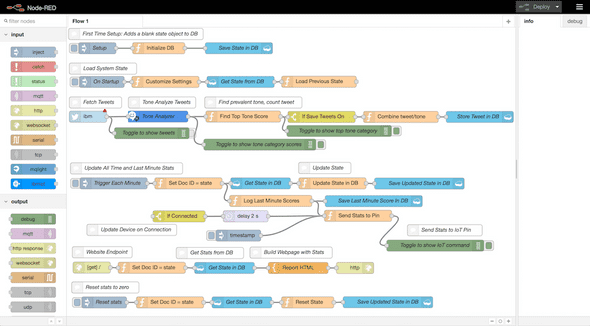
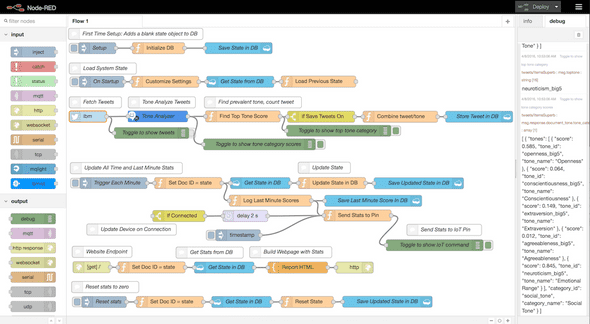
Welcome to Node-RED! This graphical interface makes it quick and easy to prototype a new application on top of the Node.js runtime environment. Nodes in the left sidebar can be dragged into the middle canvas and connected together to construct flows, or programs of functionality. You can access third-party nodes and IBM Watson nodes, just to name a few of the options.
Most of the project’s functionality is already added to the canvas. However, there are a few things left to do.
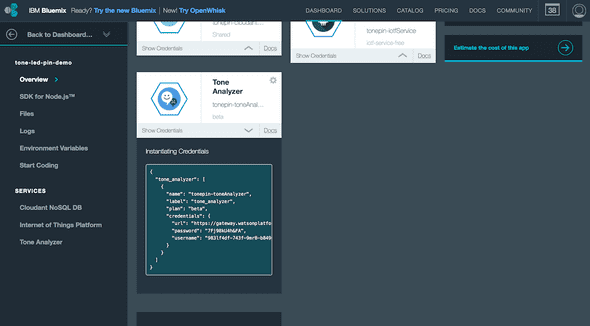
First, we need to configure the Tone Analyzer node with the service credentials from the Watson Tone Analyzer service in IBM Bluemix. Open a new tab and visit your IBM Bluemix dashboard at bluemix.net. Locate the application. In the Overview tab of your application, click on the Show Credentials link under the Tone Analyzer service tile. Inside the JSON, copy the username and password values.
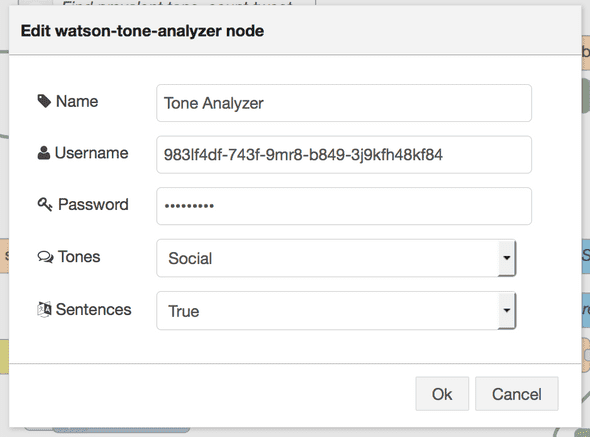
Back in Node-RED, double click on the Tone Analyzer node and enter those username and password values. Click OK.
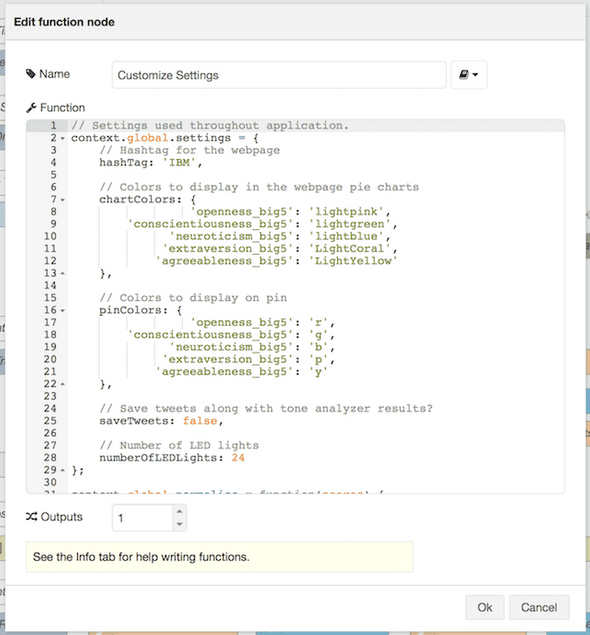
Next, double click on the Customize Settings node. Here you can customize the title and change colors. Click OK.
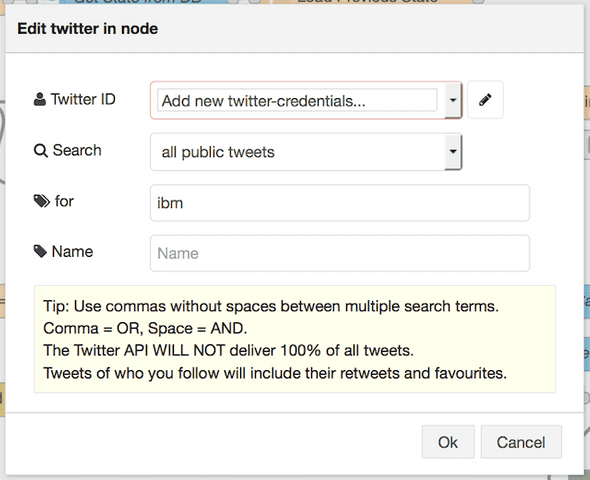
Next, double click on the Twitter node. Enter a search term in the text field titled for.
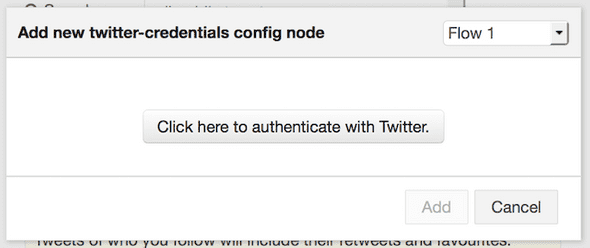
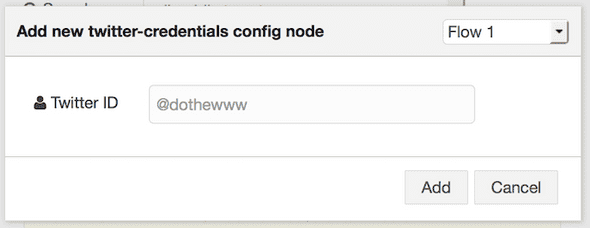
Click on the pencil icon. Click on the button labeled Click here to authenticate with Twitter. Login with a Twitter account. Don’t worry, this application won’t tweet anything. It is only required to access the Twitter API where the tweets are pulled from.
Click on the red Deploy button in the top right corner. This will save and deploy the application.
The first time you deploy this application, click on the tab of the Setup node. This will create the necessary document in the Cloudant NoSQL database where the statistics are stored. This step only needs to be done once.
Depending on how popular the search term you chose is, you may see the data flowing in the Debug tab on the right. You can toggle the green tabs to display/hide the data passing through the flows. I’ve added a couple of them for convenience to see what the application is doing.
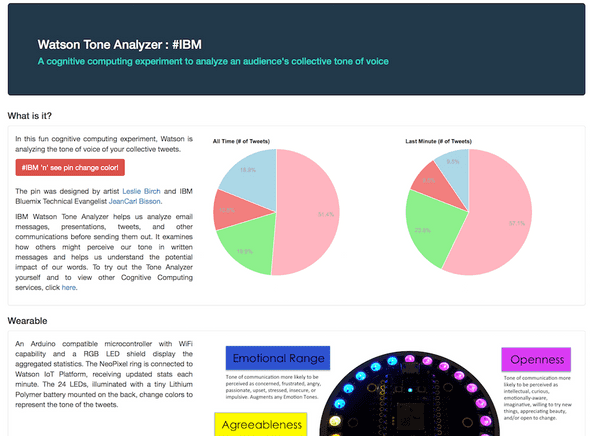
Open a new tab and visit your application’s URL. This webpage is constructed in the Report HTML node, and can be customized if desired. The webpage features two pie charts which update every minute. The one on the left shows the tone distribution of tweets since the start. The pie chart on the right displays the tone distribution of tweets from the last minute. If no tweets have been processed during this period, this pie chart won’t be displayed.
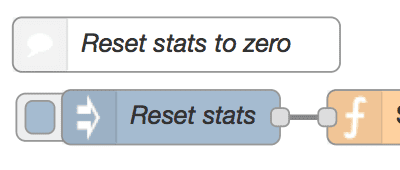
You can reset these statistics by clicking on the tab to the left of the Reset node back in the Node-RED application.
Come back next week to learn how to connect this application to the Watson Internet of Things platform and to a wearable LED pin.
A working demo that tracks tweets mentioning IBM can be found at http://tone-led-pin-demo.mybluemix.net

