Headlines Near Me with ClusterPoint and New York Times
July 21, 2015 |
ChallengePost has been hosting eight online challenges this summer as part of a series they call Summer Jam. Their fifth challenge, Maps as Art, challenged hackers to “Reimagine the world around you and unleash your inner cartographer.” So I thought why not take the New York Times headlines and map them out.
But how could I determine the location of each headline. Ideally you would process the whole story and find locations. But that isn’t easy if there are a couple of locations mentioned. Fortunately, some stories have a dateline. A dateline starts off the story with the name of the location where the story is happening.
To make things really easy, the RSS feed has such a value as one of the elements in the item element. Score! However, how do you map San Francisco when the map is looking for latitude and longitude coordinates. Using Google’s Geocoding API, we can convert the location names into these coordinates.
Next, we need a place to store all these stories, so we’ll use ClusterPoint for our NoSQL database.
Finally, we need a map to place these stories onto. We’ll use Open Street Maps for a beautiful map interface.
Sounds like a plan!
ClusterPoint
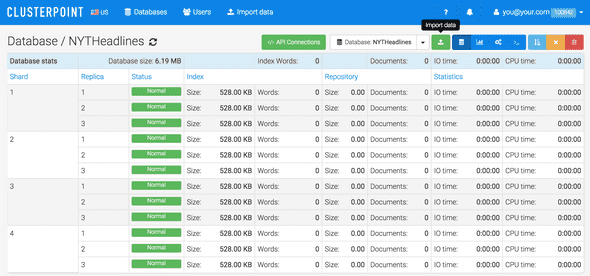
Sign up for a ClusterPoint account and create a database.
You should also create a public user with read only permission for the database. This will be used in the webpage, so it’s best to use credentials that aren’t super secret.
Google Geocoding API
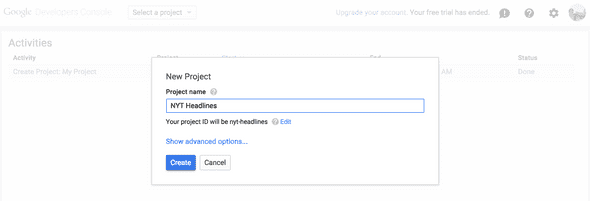
To convert location names into latitude and longitude coordinates, sign up for access to the Google Geocoding API. First register a new project.
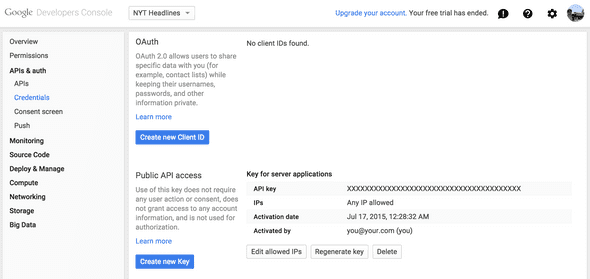
And then create a Server API key.
Setup
This project consists of a Node.js application, app.js, and a webpage index.html that displays the map.
<!-- Filename: public/index.html -->
<html ng-app="OSM">
<head>
<title>Headlines Near Me</title>
<!-- Angular Material CSS now available via Google CDN; version 0.8 used here -->
<style>
@import "https://ajax.googleapis.com/ajax/libs/angular_material/0.9.0/angular-material.min.css";
@import "https://api.tiles.mapbox.com/mapbox.js/v2.1.9/mapbox.css";
@import "https://api.tiles.mapbox.com/mapbox.js/plugins/leaflet-markercluster/v0.4.0/MarkerCluster.css";
@import "https://api.tiles.mapbox.com/mapbox.js/plugins/leaflet-markercluster/v0.4.0/MarkerCluster.Default.css";
body md-toolbar {
background-color: #3f51b5;
color: rgba(255, 255, 255, 0.87);
}
</style>
</head>
<body layout="column" ng-controller="MainCtrl">
<md-toolbar class="md-whiteframe-z3">
<div class="md-toolbar-tools">
<span flex>Headlines Near Me</span>
</div>
</md-toolbar>
<div id="map" class="md-whiteframe-z2" flex></div>
<!--Plugins-->
<script src="https://ajax.googleapis.com/ajax/libs/jquery/1.11.3/jquery.min.js" type="text/javascript"></script>
<script src="https://api.tiles.mapbox.com/mapbox.js/v2.1.9/mapbox.js"></script>
<script src="https://api.tiles.mapbox.com/mapbox.js/plugins/leaflet-markercluster/v0.4.0/leaflet.markercluster.js"></script>
<script>
$(document).ready(function () {
// Loading map from mapbox
// Setting view to london
L.mapbox.accessToken = "pk.eyJ1IjoiaW5zMWQzciIsImEiOiJmYTk5MjY4ZWMwNjVmNWVlZDdiZmQzOGE4ZWE2M2QxZCJ9.3aNjVwLZwEvRoZefs-vFvw";
var map = L.mapbox.map("map", "ins1d3r.a901164f")
.setView(current_location, 5);
// Create the marker group again
var markerGroup = new L.MarkerClusterGroup().addTo(map);
$.ajax({
url : "https://api-us.clusterpoint.com/100842/NYTHeadlines/_search?v=32",
type : "POST",
dataType : "json",
data : "{"query": "<title>~=\\"\\"</title>" +
"","list": "<lat>yes</lat>" +
"<lng>yes</lng>" +
"<url>yes</url>" +
"<title>yes</title>"," +
""docs": "1000"}",
beforeSend: function (xhr) {
// Authentication
xhr.setRequestHeader("Authorization", "Basic " + btoa("test@dothewww.com:test"));
},
success: function (data) {
if (data.documents) {
// Draw each marker
for (var i = 0; i < data.documents.length; i++) {
var marker = data.documents[i];
if (marker.lat && marker.lng) {
drawMarker(marker);
}
}
// Move view to fit markers
if (markerGroup.getLayers().length) {
map.fitBounds(markerGroup.getBounds());
}
}
},
fail: function (data) {
alert(data.error);
}
});
function drawMarker(story) {
// Set marker, set custom marker colour
var marker = L.marker([story.lat, story.lng], {
icon: L.mapbox.marker.icon({
"marker-color": "ff8888"
})
});
var published = new Date(story.published);
marker.bindPopup("<a href=""+story.url+"" target="_blank">"+story.title+"</a><br />"+story.location+"<br />"+published);
// Add to marker group layer
markerGroup.addLayer(marker);
}
});
</script>
</body>
</html>// Filename: app.js
var DATABASE = '';
var USERNAME = '';
var PASSWORD = '';
var ACCOUNT_ID = '';
var GOOGLE_GEOCODING_API_KEY = '';
var PORT = 8080;
var cps = require('cps-api');
var xpath = require('xpath')
var dom = require('xmldom').DOMParser;
var request = require('request');
var stories = [];
var express = require('express');
var app = express();
var conn = new cps.Connection('tcp://cloud-us-0.clusterpoint.com:9007', 'DATABASE', 'USERNAME', 'PASSWORD', 'document', 'document/id', {account: ACCOUNT_ID});
function getLocation(location, callback) {
request({
url: 'https://maps.googleapis.com/maps/api/geocode/json',
qs: {
address: location,
key: GOOGLE_GEOCODING_API_KEY
},
method: 'GET',
},
function(err, response, body) {
var result = JSON.parse(body);
console.log(location);
console.log(body);
callback(result.results[0].geometry.location);
}
);
}
function fetchStories() {
console.log('Fetching stories');
console.log(new Date());
request({
url: 'http://rss.nytimes.com/services/xml/rss/nyt/HomePage.xml',
method: 'GET',
},
function(err, response, body) {
var doc = new dom().parseFromString(body);
var nodes = xpath.select("//rss/channel/item[category/@domain = 'http://www.nytimes.com/namespaces/keywords/nyt_geo']", doc);
for(var i in nodes) {
var title = nodes[i].getElementsByTagName('title')[0].firstChild.data;
var guid = nodes[i].getElementsByTagName('guid')[0].firstChild.data;
var pubDate = new Date(nodes[i].getElementsByTagName('pubDate')[0].firstChild.data);
var location = '';
var categories = nodes[i].getElementsByTagName('category');
for(var j in categories) {
for(var k in categories[j].attributes) {
if(categories[j].attributes[k].localName == 'domain' && categories[j].attributes[k].value == 'http://www.nytimes.com/namespaces/keywords/nyt_geo') {
location = categories[j].firstChild.data;
break;
}
}
}
if(location.length)
stories.push({title: title, location: location, url: guid, published: pubDate.getTime()});
}
});
}
function addStory(story) {
story.id = story.url;
// TODO: Check if a id key already exists in database. If so, don't try adding it.
// Currently, CP returns error code 2626 when id key is duplicated, and this is just ignored.
conn.sendRequest(new cps.InsertRequest([story]), function (err, resp) {
if(err && err[0].code != 2626) return console.error(err);
});
}
// This fetches the stories on startup, and then at intervals.
fetchStories();
setInterval(fetchStories, 30*60*1000);
// Process through stories in a controlled manner to prevent hitting rate limits on Google's Geocoding API.
// Interval may be reduced to process more stories.
setInterval(function() {
if(stories.length == 0)
return;
var story = stories.shift();
getLocation(story.location, function(geo) {
story.lat = geo.lat;
story.lng = geo.lng;
addStory(story);
});
}, 1000);
app.use(express.static(__dirname + '/public'));
app.listen(PORT);
console.log('Application listening on port '+PORT);Insert the ClusterPoint database, username, password, and account ID into the DATABASE, USERNAME, PASSWORD, ACCOUNTID variables in app.js. Insert the Google Geocoding API Key into the GOOGLEGEOCODINGAPIKEY.
Start up the Node.js app by running the following command:
nodejs app.jsSource Code
You can find the repo on GitHub.
Headlines Near Me
There are two parts to Headlines Near Me. First, the backend. The Node.js application will fetch the RSS feed from the New York Times. By default, this happens every thirty minutes. It adds each story to a queue that is slowly processed. By default, it processes one story per second to avoid hitting the rate limit. First, the location is converted into latitude and longitude coordinates. Second, it is then added to the ClusterPoint database.
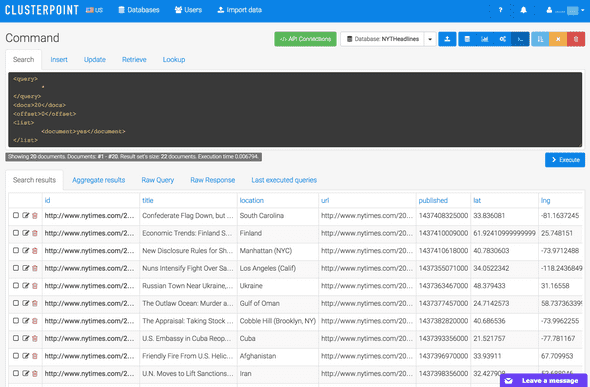
If you go back to the ClusterPoint database and run the default query, you should see a list of stories as they are processed and added.
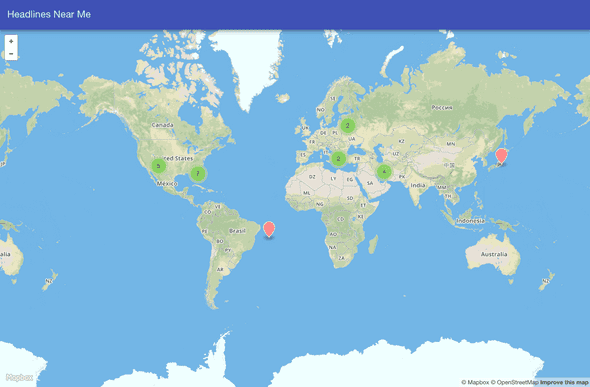
Great! We now have content to map. Open a browser to the application. The Open Street Maps map should load, fetch locations from the ClusterPoint database, and place pins on the map.
Clicking on a pin will display a window with the headline, location, and date the story was published. Clicking on the headline will take you to the New York Times website to read the story.
Post Mortem
I admit mapping headlines on a map isn’t all that interesting, per se. But when I saw what happened to the dots on the map, I realized the value in mapping headlines. First, you can see where the hotspots of news are. If a ton of stories are happening in a specific location, you may choose to focus in on that area, or, maybe, avoid that area until the activity quiets down.
Secondly, mapping stories also shows where nothing is being written about. Rather, where there may not be any coverage. Sometimes the media focuses too much on a specific area, leaving others totally in the dark. This could be used to keep journalism in check.
